Pisum Genetics
2008-Volume 40
Research Papers
A DNA marker and a refined map position for A2
Weeden, N.F. Department of Plant Sciences and Plant Pathology
Montana State University, Bozeman, MT, USA
In pea, the white flower phenotype can be produced by several mutations, including a, a2, ami and am2 (http://data.jic.bbsrc.ac.uk). However, only a and a2 actually block the synthesis of all anthocyanins in the flower, the other mutations suppress the expression of the pink to violet color of the anthocyanins by altering the pH of the vacuole (2, 6) or otherwise reducing the appearance of the color to the point that the flower can appear white (such as in a bb, kk genotype). Indeed both a and a2 block anthocyanin synthesis in all parts of the plant, and currently the phenotype produced by either mutant is indistinguishable, including increased susceptibility to pythium (9), decreased testa thickness (13).
The a gene is Mendel's 'colorless testa' mutation (8). It has been incorporated into many commercial varieties, including most of those targeted for human consumption, because seeds homozygous for this allele taste better and have better processing qualities. Although lines homozygous for the a2 mutation have not been subjected to rigorous testing, it is likely that they, too, will possess the desirable taste and processing traits shown by homozygous a plants.
The loss of the capability to synthesize any anthocyanins, as well as modification of the flavonoid components, suggest that an enzyme early in the biosynthesis pathway of flavonoids may be effected (4). Candidate enzymes include chalcone synthase (CHS) and chalcone isomerase (CHI). Earlier comparisons of these enzymes in near isogenic lines homozygous for a or A revealed no observable difference in their activity (4). Furthermore, none of the CHS genes mapped in pea were located near the A locus (1). Gorel' et al. (3) placed the A2 locus approximately 14 cM from Uni, presumably towards St, although the direction from Uni was not specified in the manuscript. Several CHS sequences are present on Medicago truncatula chromosome 3 in the region homologous to this portion of pea LG III (7). A working hypothesis for the current investigation was that one of these CHS sequences was a candidate gene for the A2 locus.
In addition, the widespread use of the a allele in commercial cultivars represents a minor narrowing of the genetic diversity in the pea crop and may represent a genetic vulnerability in the crop. The a2 allele appears to provide the same advantages as the a allele, and it would seem advisable to start incorporating the a2 allele into commercial germplasm. As the phenotypes of the two homozygotes are indistinguishable, the most efficient approach to the introgression of a2 into germplasm that is currently homozygous a is to employ marker-assisted selection. Here, I report a closely linked DNA sequence, Mips, which will be useful as a marker for a2. Additional markers and an ordering of loci in the region are also presented.
Materials and Methods
Line W6 15182 from the Pisum Genetic Stock Collection (http://www. ars .usda. gov/ main/docs.htm?docid=14120), possessing the LG III morphological markers unitac, st, apu, and le, was used as one parent. This line was crossed with an inbred line A188-78g that carried the a2 allele from D85-9, the type line for the a2 mutation. A188-78g is dominant Uni, St, Apu, and Le. The F1 was wildtype for all markers and highly fertile. The F2 was grown in the field in the summer of 2005 and scored for plant height (variation at Le), reduced stipules (st) and flower color (a2). The F3 was grown in the greenhouse in spring of 2008 and scored for variation at the loci Uni, St, Apu, A2, and Le. Several of the F3 plants were semisterile, but the fraction of the semisterile plants was low (<10%), and the trait did not appear to be tightly associated with any of the segregating mutations. F4 plants from each of 72 lines were grown in the greenhouse in summer of 2008. Six additional F3 lines that had not produced seed the previous spring were also grown at this time and included in the analysis. All these plants were scored for
1
Pisum Genetics
2008-Volume 40
Research Papers
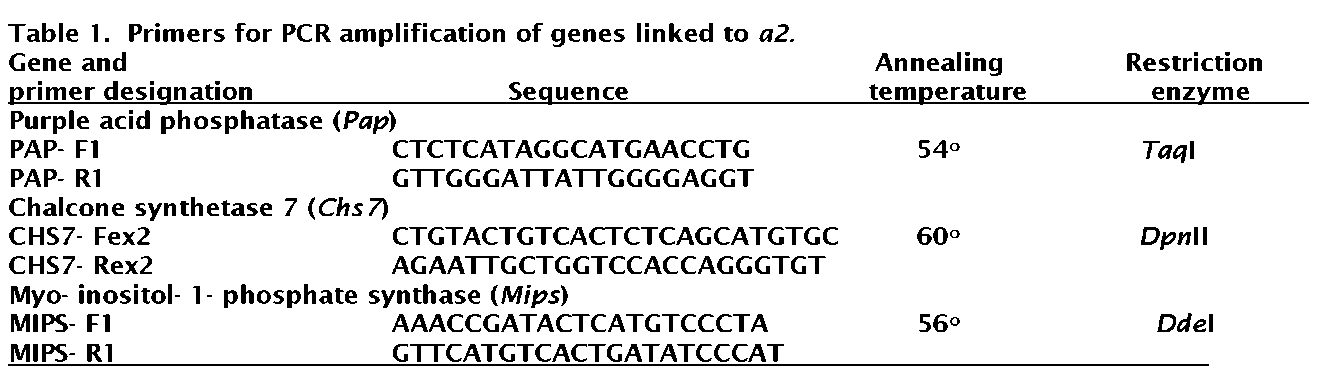
segregating morphological markers, and DNA was extracted from partially expanded leaflets using the procedure of Torres et al. (10). Primers were designed to complement sequences in either Medicago truncatula or Pisumsativum (Table 1). In order to generate gene-specific primers within the CHS family, sequences within introns were used to design primers. Annealing temperatures for the primer pairs and restriction endonucleases used to generate polymorphism are presented in Table 1.
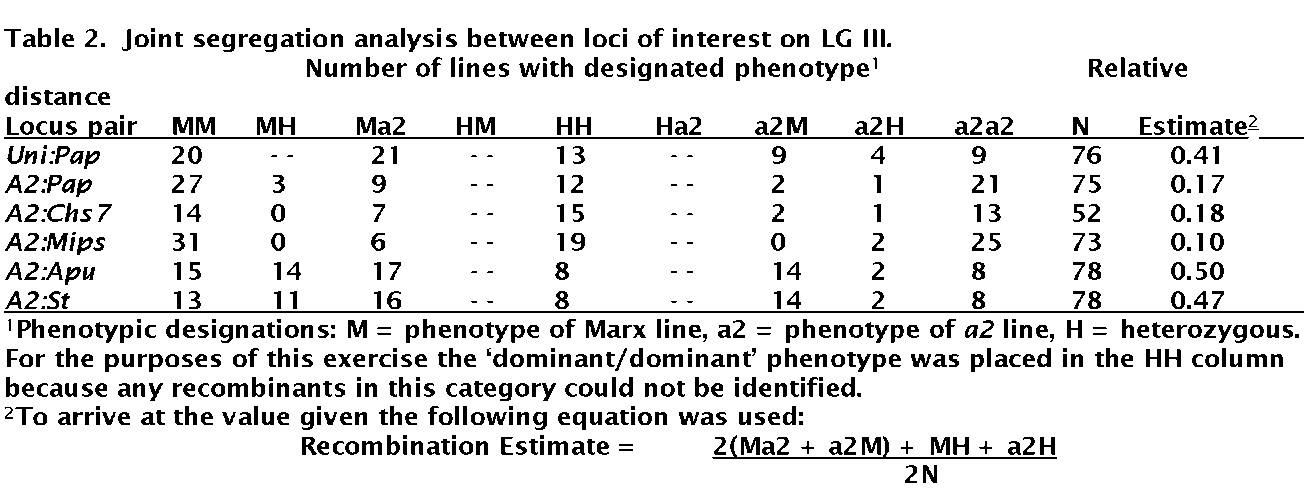
Segregation of the DNA sequences was followed using the CAPS technique (5), resolving the restricted fragments on 2% agarose gels. Due to the complexity of the population, precise recombination distances were not calculated. Instead a 'relative distance estimate' was used to determine an approximate distance between loci. The loci were arranged in a linear order that minimized total number of recombinants. Based on DNA marker results, regions within each line's LG III that appeared to be heterozygous were identified. Recombination events between adjacent loci could then be counted. Two 'distance units' were assigned for a change from a homozygous genotype of one parent to a homozygous genotype of the other but only one unit for a change from a heterozygous genotype to a homozygous genotype. The 'relative distance estimate' between each of the loci and A2 was determined by summing the number of distance units in that interval and dividing by twice the total number of lines for which both loci had been scored (see notes under Table 2). No attempt was made to account for possible recombination between a heterozygous genotype and a dominant phenotype at adjacent loci. Instead all dominant phenotypes adjacent to heterozygous genotypes were treated as heterozygotes.
Results
The scoring of the segregating morphological traits was straightforward except that the pigmentation of flowers on A2_ plants was occasionally faint. The gene b was fixed in the population, so that all A2_ plants had pink flowers. However, it appeared that another gene was affecting the expression of the pink color of the b phenotype in certain lines. Fortunately, leaf axil pigmentation, conferred by dominant alleles at the D locus, was contributed by both parents, and pigmentation in the leaf axil proved to be a more reliable indicator of the presence of the A2 allele than flower pigmentation. All white-flowered plants were examined for lack of pigmentation in the leaf axils and on the testa of the seeds before classifying them homozygous a2.
The purple acid phosphatase primers generated a principle fragment of about 900 bp and several smaller, fainter staining fragments. Restricting the amplified product with TaqI endonuclease produced a multi-fragment pattern indicative of more than a single gene product. TaqI digestion of the 900 bp fragment in Marx line W6 15182 completely digested the original fragment, giving 5 smaller fragments that had a combined size of over twice the original fragment. A similar digest of the original fragment from the a2 parent gave 4 fragments, including the original 900 bp fragment and 3 others that matched 3 of the 5 observed in the digest of the original fragment from the Marx line. I tried several other primers for this gene, all of which gave digests indicating a multigene cluster, and several of which gave different restriction patterns between the two parents. Those polymorphisms that were mapped all co-segregated, suggesting that all polymorphic copies of the gene were clustered.
2
Pisum Genetics
2008-Volume 40
Research Papers
The chalcone synthetase primers amplified a single 850 bp fragment. This fragment was cut into 650 and 200 bp fragments in the Marx line and into 350, 300 and 200 bp fragments in the a2 parent. These two phenotypes were found in most of the lines of the mapping population, with a third phenotype, displaying all 4 fragments, identifying heterozygotes. The myo-inositol-1-phosphate synthase primers amplified a single 1000 bp fragment. This fragment was cut into 800 and 200 bp fragments in the original a2 parent but was not cut in the Marx line. All these DNA markers exhibited codominant expression, and the percentage of heterozygotes in the F4 lines was compared to that expected in an F4 population (12.5%). All three DNA markers showed between 18-20% heterozygosity, significantly higher than that expected.
The joint segregation data for a2 with st, apu, purple acid phosphatase, chalcone synthetase 7, and myo-inositol-1-phosphate synthase are presented in Table 2. The three DNA markers and a2 formed a well defined linkage block, with the order: Pap—Chs7—Mips—A2. The two morphological loci, St and Apu, segregated independently of A2 in the F4 population. The joint segregation between Uni and Pap also was investigated (Table 2), and these two loci also display only weak linkage. Le also segregated independently of the other loci examined (data not presented).
Discussion
Based on the consensus map for pea (11), the overall locus order was expected to be Uni—A2—Apu— St—Le. The data generated in this study are consistent with this order and identify three DNA markers that are more closely linked to A2 than any of the loci controlling morphological traits. The actual order of the loci based on minimizing the number of recombinants was determined to be: Uni --- Pap --- Chs7 --­Mips A2 Apu St. Note that Uni, Apu and St are placed on this linkage group using data from other sources (3, 11, Weeden, unpublished) and that the orientation of Apu and St relative to A2 is based on minimizing number of recombinants and not on relative distance estimates.
The complex nature of the population prevents the calculation of a precise genetic distance. The frequency of heterozygotes in the population analyzed was sufficiently high to preclude the use of equations designed for recombinant inbred populations. Instead, relative distances were calculated that should permit the comparison of distances among the loci and estimates of genetic distances using data from other studies. Gorel et al. (3) found a genetic distance between Uni and A2 to be about 14 cM and that between A2 and St to be about 27 cM. The corresponding relative distance values obtained in the current study were 0.58 and 0.47, respectively, suggesting that the relative distance values may be converted to rough centiMorgan equivalents by multiplying by 60. Such a conversion would place Mips about 6 cM from A2, sufficiently close to be used as a tag for the latter locus.
3
Pisum Genetics
2008-Volume 40
Research Papers
The purple acid phosphatase and chalcone synthase markers are two additional genes in the region that are also present on Medicago truncatula chromosome 3 (12). Based on the size and number of products observed after endonuclease digestion, the purple acid phosphatase appears to represent a cluster of at least three homologous sequences. In the JI1794 x Slow mapping population the cluster co-segregates with the isozyme locus Acp3, placing it at centiMorgan 54 of LG III on the consensus map and suggesting that one of the sequences may code for Acp3.
The mapping results for a2 do not support my original hypothesis that a mutation in a CHS sequence is responsible for the white-flowered phenotype conditioned by this gene. There are several chalcone synthase sequences on pea LG III and in the corresponding region of the M. truncatula chromosome 3. The primer sequences given in Table 1 were designed to PsCHS7B (NCBI accession number D88263) to sequences in the introns flanking exon 2. These sequences are relatively specific to this gene in pea and show strong homology only to two M. truncatula chalcone synthase genes in BAC mth2-179n10 (AC146683) on chromosome 3 and BAC mth2-14m10 (AC137985) on chromosome 1. It appears that PsCHS7A and B are orthologous to the M. truncatula chalcone synthase genes in BAC mth2-179n10. The pea Chs7 sequence maps 10-15 cM from A2, and the M. truncatula chromosome 3 sequence does not have another CHS gene distal to BAC mth2-179n10.
Interestingly, in M. truncatula the purple acid phosphatase and CHS sequences are less than 500 kb from each other (7). Such a short distance would normally preclude observation of recombination between the two genes in a population of the size used in this study. In M. truncatula the two loci map to statistically indistinguishable positions (62-63 cM, reference 7). The observation of recombination between purple acid phosphatase and Chs7 in pea may indicate that the polymorphisms observed using the Pap primers do not involve the pea ortholog of the sequence on BAC mth2-17k6 or that this region of pea LG III is slightly rearranged relative to the M. truncatula chromosome. Alternative candidate genes for Acp3 in this region of the M. truncatula chromosome (e.g. other acid phosphatase sequences) have yet to be identified (7).
1. An, C., Ichinose, Y., Yamada, T. et al. 1993. Plant Mol. Biol. 21:789-803.
2. Crowden, R.K. 1982. Phytochemistry 21:2898-2890.
3. Gorel', F.L., Rozov, S.M. and Berdnikov, V.A. 1997. Pisum Genetics 29:39.
4. Hrazdina, G. and Weeden, N.F. 1986. Biochem. Genet. 24:309-317.
5. Jarvis, P., Lister, C., Szabo, V. and Dean, C. 1994. Plant Molec. Biol. 24:685-687.
6. Marx, G.A. 1978. PNL 10:38-40.
7. Medicago Genome Sequence Consortium. 2007. http://www.medicago.org/genome/
8. Mendel, G. 1865. Verh. Naturfosch. Ver. Brunn, Vol 4:3-47.
9. Powell, A. A. 1989. Ann. Bot. 63:169-175.
10. Torres, A.M., Weeden, N.F. and Martin, A. 1993. Theor. Appl. Genet. 85:937-945.
11. Weeden, N.F., Ellis, T.H.N., Timmerman-Vaughan, G.M. et al. 1998. Pisum Genetics 30:1-4.
12. Weeden, N.F. and Moffet, M.D. 2007. Pisum Genetics 39:45-63.
13. Werker, E., Marbach, I., and Mayer, A.M. 1978. Ann. Bot. 43:765-771.
4