![]()
![]()
PsPao DNA
sequence à
![]()
![]()
Pheophorbide a monooxygenase (Pao) is located on LG VII near Amy in pea and lentil
Moffet, M.D. and Weeden, N.F. Dept. of Plant Sci. and Plant Path.
Montana State Univ.,
The gene coding the enzyme pheophorbide a monooxygenase (PAO) was first identified by a light dependent lesion mimic in Zea mays, called the lethal leaf spot mutation (lls1) (6). The leaves of this mutant stay green during dark incubation and accumulate pheide a, causing a light-dependent lesion mimic phenotype. The protein contains a Rieske iron–sulfur cluster and conserved C-terminal motif in both plant and cyanobacteria (6). PAO catalyzes the third step in chlorophyll degradation (Fig. 1).
|
Chl Mg dechelatase PAO RCCR * chlorophyll a ---> chlorophyllide a----> pheophorbide a ----> RCC -----> pFCC ---> NCC
|
Fig. 1. Basic pathway of chlorophyll degradation.
Substrates: abbreviations – RCC, red chlorophyll catabolite; pFCC, primary fluorescent chlorophyll catabolite; NCC, non-fluorescent chlorophyll catabolite)
Enzymes: abbreviations – Chl, chlorophyllase; PAO, pheophorbide a oxygenase; RCCR, red chlorophyll catabolite reductase; *low pH and multiple enzymes)
PAO has also been shown to be a member of a small non-heme oxygenase family that includes chlorophyll a oxygenase (CAO), choline monooxygenase (CMO), a 55 kD inner chloroplast membrane translocation protein (Tic55), and a 52 kD translocation protein for protochlorophyllide oxidoreductase A in chloroplasts (Ptc52) (7). Homologs of Lls1 (Pao1) have been subsequently identified in Lycopersicon esculentum, Oryza sativa, Arabidopsis thaliana, Medicago truncatula, Pinus tuneada, Solanum tuberosum, and Vigna unguiculata (8, 21). The A. thaliana homolog, accelerated cell death (Acd1, At3g44880, gi: 42565541), displayed less than 80% sequence identity with the Zea mays gene and was not universally accepted as the Pao1 ortholog until the latter gene was used to complement an Acd1 null mutant in Arabidopsis (21). Additional articles have been published confirming and restating the Lls1 product is PAO (8, 9, 12).
The ‘stay-green’ phenotype of the lls1 mutant lead some researchers to propose Pao as a candidate for Mendel’s i gene in pea, particularly after it was demonstrated that PAO activity was greatly reduced in green cotyledons (15). This study has led to the acceptance by many that the genetic basis of the i mutant is known (4, 15, 16). Here we present evidence that the Pao gene in pea is located on LG VII, not on LG I and, therefore, cannot be synonymous with the genetic defect generating the green/yellow cotyledon polymorphism.
Materials and Methods
Amplification of PsPao: Homologous mRNA sequences were obtained using a tomato EST (AF321984 [gi: 16973464]) for BLAST at NCBI; identifying Arabidopsis thaliana (At3g43880 [gi: 42565541]), maize (U77346 [gi: 1935910]), Medicago truncatula (TC100809) and Vigna unguliata (gi: 30088963) for comparison of highly conserved regions and positions of introns. The gene structure (Fig. 2) and expected fragment sizes of the primer sequences in Pisum, Lens, and Phaseolus (Table 1) is presented below. The primer sequences used for amplification were Pao-F2 (5’GGAGAGATCATTGGTAYCCAGTTTC3’) and Pao-R3 (5’GTGAAMGTGAGSRTTGTGTACTG3’). In order to prevent mis-priming at lower annealing temperatures a touchdown protocol was used with each primer pair for sequencing. Cleaved Amplified Polymorphic Sequences (CAPS) analysis (11) was performed with a standard PCR protocol (all primer combinations worked with a 58° C annealing temperature and a 2 minute extension) using Taq polymerase (Promega).
|
PsPao DNA
sequence à
|
Fig. 2. PsPao gene model based on the gene splicing of AtPao.
The two PsPao fragments were cloned using a pCR2.1 kit (Invitrogen) according to the manufacturer’s recommended procedures. The two clones PsPao-WL808 and PsPao-MN313 were partially sequenced from both ends. Internal primers were designed to permit sequencing of the remaining genomic sequence (final sequence not available).
Amplification of other gene fragments: PCR procedures used for isovaleryl dehydrogenase (IVDH), b-amylase, Sym29 and RAPDs were all done with Promega Taq polymerase. IVDH, b-amylase, and Sym29 were amplified using a PCR protocol with a 60° C annealing temperature, a 2 minute extension and 40 cycles. The RAPDs were done with a 37° C annealing temperature, 2 minute extension and 35 cycles.
Sequencing: Sequencing was carried out by the CORE facility at WSU-Pullman. Purified sequence and primers were sent to the sequencing lab for dye incorporation and sequencing.
Populations used for mapping PsPao:
The sequence generated by Pao-F2/-R3 was initially mapped in the JI1794
x Slow
RIL population that has been used as the basis of the Pisum sativum
consensus map (3, 20). The map
position was confirmed in two other pea RIL populations.
The first of these is a [P. sativum ssp. sativum
x P.
s.
ssp. abyssincum] x
P. s. ssp. sativum BC1F5 population
consisting of 62 lines. The second
is an F2-derived F5 population from the cross PI 220174 x A1078-239.
PI 220174 was collected in
Detection of polymorphism: Polymorphism in DNA fragments was detected based on original fragment size, when different, or CAPS analysis. Fragments were separated on 2% agarose gels. The b-amylase polymorphism was also confirmed in the pea populations by isozyme analysis on a tris-citrate/lithium borate system (1) using young leaf extracts.
Estimation of recombination frequencies: Recombination frequencies between pairs of loci in F2-derived RILs were obtained by the equation r = R/(2-2R) (5). For small recombination frequencies (r<0.1) this equation also provides a good approximation for r in the backcross RIL population.
The fragment generated by the Pao-F2/R3 primer pair in pea was approximately the same size as predicted from the arabidopsis gene model (Table 1). Sequencing of the fragments amplified from MN313 and WL808 gave the end sequences presented in Fig 3. Approximately 95% homology was observed between the two lines with five possible SNPs, as presented in Fig. 3. Two additional primers were designed to the verified nucleotide sequence and were used in mapping Pao. Sequences for the additional primers are Pao_INT-F: 5’-GCAGGAGGGAAGGATAGATGAG and Pao_INT-R: 5’-CTATCNCTTCTTCCTGTGACC.
Table 1. Primer Combinations – Expected vs. Actual Fragment Size in 2% SB agarose gels
|
|
Exp. Pea Size |
Act. Pea Size |
Lens Size |
Phaseolus Size |
|
Pao_INT-F/INT-R |
700bp |
>700bp |
900bp |
Faint band |
|
Pao-F2/INT-R* |
1100bp |
~1100bp* |
1300bp* |
Faint band |
|
Pao_INT-F/R3* |
1300bp |
~1300bp/1200bp* |
~1050bp |
~1150bp |
|
Pao-F2/R3+ |
1616bp |
~1600/1700bp+ |
Faint band |
Faint band |
*Primers used to map Pao.
+Primer pairs used in sequencing Pao.
SB – Sodium-borate buffer.
The size of the Pao fragment amplified by Pao_INT-F/R3 or F2/R3 differed between JI 1794 and Slow, allowing the segregation pattern to be observed directly on the 2% SB agarose gel without further restriction (Fig 4A). Similarly, a size difference was observed in the direct products amplified in the two Lens parents when the same primer pairs were used. In the other two populations CAPS was used to reveal a polymorphism, with Pao-F2/INT_R being used in the Abyssincium backcross RIL with CfoI (Fig 4B) and Pao_INT-F/R3 in the Afghanistan RIL cut with HinfI. In both pea and lentil a size polymorphism could be viewed when the second half or two-thirds of the gene was amplified, when the first half of the gene was amplified no size polymorphism was observed. Thus in both pea and lentil two alleles, both differing in the second half of the gene by ~100 bp, were observed.
Segregation of the various markers investigated in the analysis did not differ significantly from the expected 1:1 or 3:1 ratios expected in the F2-derived or BC-derived RILs, respectively. Joint segregation analysis between Amy and Pao in each of the pea populations indicted a recombination value between 3 and 7 cM (Table 2). A comparable recombination value was obtained between the two loci in Lens.
Table 2. Joint segregation analysis between the loci Amy and Pao in four RIL populations. Number of lines with designated genotype
|
Population |
P1P1 |
P1H |
P1P2 |
HP1 |
HH |
HP2 |
P2P1 |
P2H |
P2P2 |
N |
r |
|
JI1794 x Slow |
19 |
0 |
3 |
0 |
0 |
0 |
0 |
0 |
27 |
49 |
3.3 |
|
BC1F5 |
11 |
0 |
3 |
0 |
0 |
0 |
2 |
0 |
46 |
62 |
4.4 |
|
|
8 |
0 |
0 |
1 |
0 |
1 |
2 |
0 |
12 |
24 |
7.1 |
L.c. 7 x L.e. 32 |
22 |
0 |
2 |
0 |
0 |
0 |
0 |
0 |
22 |
46 |
2.3 |
Pao could be further fine-mapped in the JI1794 x Slow population using the dense marker map available for this set of RILs. The segregation data unambiguously placed Pao on LG VII between Amy and Sym29 (Fig. 5).
 |
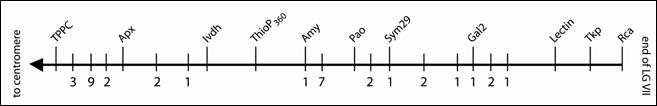
Fig 5. Linkage map for the distal 34 cM of the lower arm of LG VII in the JI1794 x Slow RIL population. Isozyme or STS loci are given above the horizontal bar, and the numbers below the bar indicate the position and number of RAPDs in the region.
Discussion
A mutation at the Pao locus could provide an explanation for the green cotyledon phenotype of pea because of the enzyme’s participation in the short pathway of chlorophyll degradation. PAO converts green chlorophyllide a to light green pheophorbide a, and a mutation at Pao could cause the cotyledons to remain green as a result of the lack of chlorophylide a breakdown. However, our mapping data here demonstrate that Pao is located on LG VII of pea, not at the I locus on LG I, thereby eliminating Pao as a candidate gene for I. The finding by Thomas et al. (15) that PAO activity is significantly reduced in pea lines with green cotyledons suggests that PAO may be directly involved in producing the green cotyledon phenotype in seeds but that the genetic mechanism is specific to the cotyledon tissue (chlorophyll degradation in leaf or pod tissue does not appear to be affected by the i mutation). We are forced to conclude that I is most likely either a factor controlling transcription of the Pao gene in cotyledons or influencing the transport/processing of the initial translation product in the same tissue. A less likely possibility is that I codes for a factor influencing another enzyme in the degradation pathway in cotyledons, possibly an upstream enzyme such as chlorophyllase.
It has been suggested that PAO is expressed only in senescent tissue (17), making the coding sequence a more plausible candidate gene for a ‘stay-green’ phenotype. However northern blot analysis of Pao expression in tomato (M.D. Moffet and D.R. Bergey, unpublished) and detection of PAO in etiolated pea seedlings using antibodies (21) establish that Pao is generally constitutively expressed in many tissues and may be involved in other functions besides senescence-related chlorophyll breakdown. PAO may not be an appropriate candidate gene for many ‘stay-green’ mutants. For instance, ‘stay-green’ in bean is only associated with the retention of thylakoid proteins, indicating regulation of PAO activity does not cause the stay-green phenotype in Phaseolus (2). Similarly, Pao is not responsible for the ‘stay-green’ mutation in arabidopsis (14).
Linkage analysis of Pao in Lens indicated conservation of synteny, with lentil Pao also displaying linkage with Amy and other markers on pea LG VII. Much of the region also appears to be conserved in Medicago truncatula. For example, the Medicago BAC mth2-11o4 contains a sequence that, except for apparent introns, is identical to the Pao mRNA from M. truncatula. This BAC has been placed on linkage group 4 (http://medicago.org), the linkage group identified as partially homologous to pea LG VII (10). A Sym29 sequence is located on this same BAC, paralleling the tight linkage between Pao and Sym29 observed in pea. Furthermore, ascorbate peroxidase and isovaleryl dehydrogenase sequences are found on linked BACs (mth2-27j21 and mth2-65c4, respectively). One interesting aspect of the comparison of the different Pao genes is that the introns in MtPao are much larger than those in any of the other genes investigated (pea, lentil, Phaseolus and arabidopsis).
Finally, the introns of the Pao gene appear to be relatively polymorphic, even within species. The primers used generally amplified a single major product in each of the genera examined, suggesting that they will reliably amplify orthologous loci in different legume species. Thus, Pao should be very useful in PCR-based map generation and marker assisted selection (MAS) in breeding projects.
Acknowledgment: Thanks to Dr. Dan Bergey formerly of MSU-Bozeman, now at Black Hills State-SD, for starting the senior author on this project as an undergraduate.
1. Ashton, G.C. and Braden, A.W.H. 1961. Austral. J. Biol. Sci. 14: 248-254.
2. Bachman, A., Fernandez, L.J., Ginsburg, S., Thomas, H., Bouwkamp, J.C. and Solomos, T. 1994. New Phytol. 126: 593-600.
3. Brauner, S., Murphy, R.L., Walling, J.G., Przyborowski, J. and Weeden, N.F. 2002. J. Am. Soc. Hort. Sci. 127: 616-622.
4. Buchanan, B. 2000.
Biochemistry and Molecular Biology
of Plants, John Wiley and Sons,
5. Burr, B., Burr, F.A., Thompson, K.H. and Albertson, C.W. 1988. Genetics 118: 519-526.
6. Gray, J., Close, P.S., Briggs, S.P. and Johal, G.S. 1997. Cell 89: 25–31.
7. Gray, J., Janick-Buckner, D., Buckner, B., Close, P.S., and Johal, G.S. 2002. Plant Physiol. 130: 1–14.
8. Gray, J., Wardzala, E., Yang, M., Reinbothe, S., Haller, S. and Pauli, F. 2004. Plant Mol. Biol. 54: 39-54.
9. Hortensteiner, S. 1999. Cell. Mol. Life Sci. 56: 330–347.
10.
Kalo, P., Seres, A.,
11. Konieczny, A. and Ausubel, F. 1993. Plant J. 4: 403-410.
12.
Pružinská, A., Tanner, G., Anders,
I.,
13. Tadmor, Y., Zamir, D. and Ladizinsky, G. 1987. Theor. Appl. Genet. 73: 883-892.
14. Tanaka, R., Hirashima, M., Satoh, S., and Tanaka, A. 2003. Plant Cell Physiol. 44: 1266-74.
15. Thomas, H., Schellenberg, M., Vicentini, F. and Matile, P. 1996. Bot. Acta 109:3–4.
16. Thomas, H., and Howarth, C.J. 2000. J. Exp. Bot. 51: 329-337.