A suggestion that D is also responsible for stem anthocyanin
Weeden, N.F. Dept. Plant Sci. and Plant Path., Montana State Univ.
Bozeman, MT
The locus D controls anthocyanin production in leaf axils (6) and has several alleles that produce different patterns of red pigmentation in this region (2). Marx and Nozzolillo identified an association between Dw and anthocyanin deposits on the stem of seedlings, although they did not distinguish between whether the stem anthocyanin deposits were a pleiotropic effect of Dw or the product of a closely linked gene. Swiecicki (4) further explored the genetics of stem pigmentation in the line Wt10225, finding recombinant phenotypes in the F2 of the cross Wt10225 x Wt11238. He therefore defined Ans (anthocyanin seedlings) as a second locus, approximately 6 cM from D, that controlled anthocyanin production at the base of the stem in seedlings of the line Wt10225. More recently, Nazari and Sharma (3) found no recombination between D and Ans, but maintained Ans as a separate locus based on different recombination frequencies of D and Ans with nearby loci.
The line JI1794 also displays red pigment at the base of the stem in seedlings. In addition, anthocyanin deposits are often observed on the upper internodes and particularly on the pedicels. This line lacks anthocyanin pigmentation in the leaf axils. When JI1794 was crossed to line ‘Slow’ (Dco, no stem anthocyanin), the F1 displayed both Dco and stem anthocyanins, confirming the dominate nature of Dco and suggesting that the red pigmentation on the stem was also controlled by a dominant allele. The 53 F2-derived recombinant inbred lines (RILs) available for this population formed the basis of the consensus map of pea (5) with over 1000 markers having been mapped. The high degree of marker saturation in the map should permit the determination of whether a second locus besides D is influencing anthocyanin pattern on the stem.
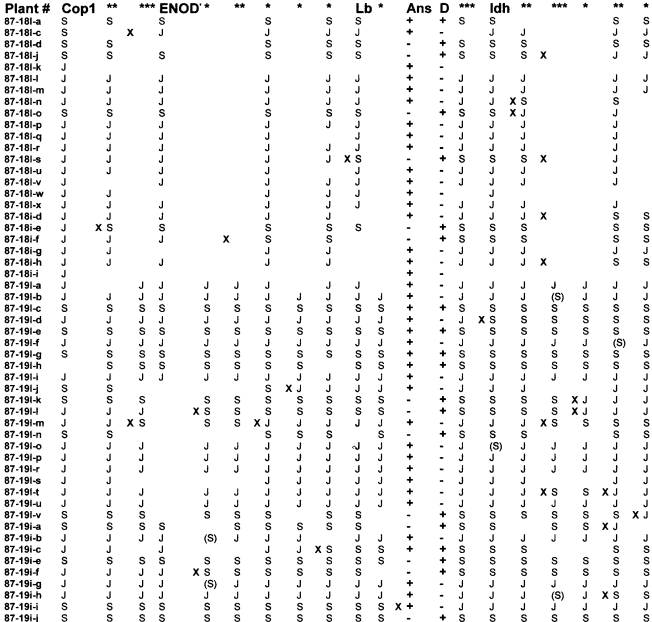
The phenotype segregation among the RILs was 13 Dco /ans (Slow parent phenotype), 34 d/Ans (JI1794 phenotype), 6 Dco /Ans (F1 phenotype) and 0 d/ans (the other recombinant phenotype). The six lines with apparent the recombinant phenotype included four (87-18I-a, 87-19I-c, 87-19I-e, and 87-19I-h) that gave a relatively faint stem anthocyanin phenotype along with a strong Dco phenotype and two (87-19I-g and 87-19i-c) that gave strong stem anthocyanin and strong Dco expression. Thus by phenotypic analysis two linked loci appeared to be present, in concordance with the findings of Swiecicki. However, attempts to map the second locus failed to identify an unambiguous location. Fig. 1 presents the segregation patterns for markers in the vicinity of D. When the six presumed ‘recombinants’ are compared for segregation of markers in the 10 cM to each side of D, five of the lines uniformly possess the ‘Slow’ genotypes in this region. The sixth, 87-19i-c, displays a recombination to the JI1794 genotype about 3 cM from D on the CopI side. Many of the other lines in the population show recombination in the 10 cM flanking D yet fail to display a recombinant phenotype for anthocyanin pattern.
These data suggest that the apparent recombinant phenotype observed in the six lines is not a result of classical genetic recombination. Rather, an alternative hypothesis is required, quite possibly leakiness of the phenotype. As noted by Swiecicki, the expression of anthocyanin in Ans plants is highly variable. Such variation was also observed in the six lines exhibiting a ‘recombinant phenotype.’ I conclude that least in JI1794, the red pigment on the seedling and upper stem and pedicels appears to be due to an allele at D, which I refer to as Drs (for red stem).
Fig. 1. Data for markers mapping to the region of linkage group I flanking D. The region shown spans approximately 25 cM. The genotype of a recombinant inbred line is given on a horizontal line with S indicating homozygosity for the allele from ‘Slow’ and J indicating homozygosity for the allele from JI1794. Each column represents a distinct segregation pattern. Anchor markers include Cop1, Enod7, leghemoglobin (Lb), D, and Idh. RAPD markers are denoted by asterisks, and the number of asterisks at the top of a column reflects the number of RAPDs for which that segregation pattern was observed. Complete data sets are not available for most markers. Locations of recombination events are indicated by a bold x. Data in parentheses are RAPD data that display recombination with both flanking markers and thus may reflect mispriming or inaccurate scoring. Lines displaying both red stem (+ for Ans) and axil pigmentation (+ for D) include 87-18I-a, 37-19I-c, 87-19I-e, 87-19I-g, 87-19I-h, and 87-19i-c. All of these have the ‘Slow’ allele at flanking markers, and shifting the Ans column either to the right or left increases rather than decreases the number of recombination events in the matrix.
1. Marx, G.A. and Nozzolillo, C. 1979. Pisum Newslett. 11: 25-27.
2. Matthews, P. and Snoad, B. 1969. Pisum Newslett. 1: 12-13.
3. Nazari, A.H. and Sharma, B. 2001. J. Genet. & Breed. 55:335-341.
4. Swiecicki, W.K. 1990. Pisum Newslett. 22: 59-61.
5. Weeden, N.F., Ellis, T.H.N., Timmerman-Vaughan, G.M., Swiecicki, W.K., Rozov, S.M. and Bernikov, V.A. 1998. Pisum Genetics. 30: 1-4.
6. White, O.E. 1917. Proc. Am. Phil. Soc. 56: 487-588.