|
Pisum Genetics |
Volume 24 |
1992 |
Research Reports |
pages 44-47 |
Evidence supporting the revision and integration of the pea chromosome 7 linkage map
|
Folta, K.M. and Polans, N.O.
|
Department of Biological Sciences Northern Illinois University DeKalb, Illinois 60115, USA |
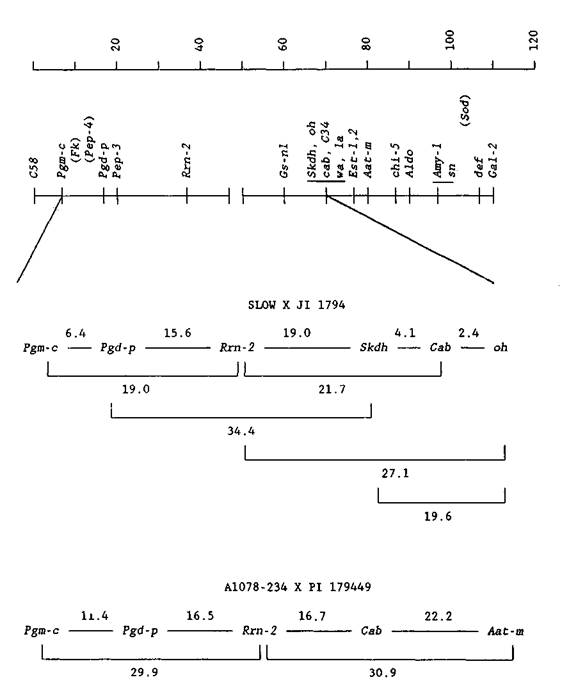
The application of biochemical and molecular technology to the development of the pea linkage map has not only increased the overall number of available genetic marker loci, but has also revealed linkage associations that sometimes differ markedly from the previously accepted relationships presented by Blixt (1). Based on their own studies, as well as the findings of a number of other geneticists and cytogeneticists, Weeden and Wolko (8) have suggested substantial rearrangements for chromosomes 2, 5 and 7. The most recent proposal extending from this work is summarized on the cover of volume 23 of Puum Genetics; a portion of this revised map is included below in Fig. 1.
The observation that much of the former chromosome 7 linkage group (most notably, r and tl) resides on chromosome 5 has already gained additional support (2, 5). The proposal that the (upper) nucleolar organizer region of chromosome 7 is linked with the upper arm segment of former chromosome 2, however, requires further corroboration.
In Table 1 and Fig. 1, evidence is presented of linkage associations that span these previously unrelated groups of genes assigned to chromosome 7. Data obtained for the F2 progeny from two independent crosses, SLOW x JI1794 and A1078-234 x PI179449, verify linkage between genetic loci formerly assigned to chromosome 7 (Skdh, Cab, oh and Aat-m) and genes associated with the nucleolar organizer region of chromosome 7 (Pgm-c, Pgd-p and Rrn-2). (Please note that designations for both Rrn-2 and Cab have been modified to conform with standard nomenclature).
The linkage distances shown in Fig. 1 display internal consistency and they are reasonably close to values generated by other mapping studies, with the obvious exception of the large recombinant fraction (19.6 ± 5.0%) for Skdh and oh. Previos investigations (3, 7) have characterized these loci as very tightly linked, more in keeping with the map distances shown here for Skdh - Cab and Cab - oh. Notwithstanding this discrepancy, the data clearly corroborate the revision of chromosome 7 and assign both of its segments to the same linkage group.
Acknowledgements. The authors thank both the Biomedical Research Grant Program, National Institutes of Health, and the Northern Illinois University Graduate School for financial support.
Table 1. Joint segregation analyses for chromosome 7 genetic marker loci.
|
|
Number of F2 progeny in each genotypic class a |
||||||||||||
|
Loci |
11.11 |
11.12 |
11.22 |
12.11 |
12.12 |
12.22 |
22.11 |
22.12 |
22.22 |
n |
c2 |
P |
Recombinant fraction g |
|
|
SLOW X JI 1794 |
|
|
|
|||||||||
|
Pgm-c, Pgd-pb |
21 |
4 |
0 |
6 |
43 |
1 |
0 |
1 |
21 |
97 |
133.5 |
<<0.001 |
6.4 ± 1.8 |
|
Pgd-p, Rrn-2c |
15 |
|
10 |
3 |
|
41 |
0 |
|
20 |
89 |
34.5 |
<<0.001 |
15.6 ± 4.1 |
|
Pgm-c, Rrn-2c |
14 |
|
11 |
5 |
|
40 |
0 |
|
20 |
90 |
26.3 |
<<0.001 |
19.0 ± 4.5 |
|
Skdh, Rrn-2c |
9 |
|
5 |
10 |
|
45 |
0 |
|
22 |
91 |
22.0 |
<<0.001 |
19.0 ± 4.5 |
|
Pgd-p, Skdhb |
9 |
15 |
3 |
5 |
31 |
13 |
2 |
11 |
9 |
98 |
11.4 |
<0.05 |
34.4 ± 4.4 |
|
Skdh, Cabb |
10 |
1 |
0 |
1 |
34 |
2 |
0 |
1 |
14 |
63 |
96.0 |
<<0.001 |
4.1 ± 1.8 |
|
Cab, Rrn-2c |
5 |
|
3 |
5 |
|
29 |
1 |
|
12 |
55 |
10,9 |
<0.01 |
21.7 ± 6.2 |
|
Cab, ohd |
9 |
|
0 |
21 |
|
0 |
1 |
|
10 |
41 |
36.1 |
<<0.001 |
2.4 ± 2.4 |
|
Rrn-2, ohe |
16 |
|
1 |
|
|
|
39 |
|
14 |
70 |
3.2 |
<0.1 |
27.1 ± 10.9 |
|
Skdh, ohd |
15 |
|
1 |
36 |
|
4 |
8 |
|
12 |
76 |
22.2 |
<<0.001 |
19.6 ± 5.0 |
|
|
A1078 -234 X PI 179449 f |
|
|
||||||||||
|
Pgm-c, Pgd-pb |
11 |
1 |
1 |
3 |
22 |
5 |
0 |
2 |
15 |
60 |
61.1 |
<<0.001 |
11.4 + 3.1 |
|
Pgd-p, Rrn-2b |
10 |
0 |
0 |
4 |
11 |
4 |
0 |
7 |
12 |
48 |
38.3 |
<<0.001 |
16.5 ± 4.2 |
|
Pgm-c, Rrn-2b |
7 |
1 |
2 |
5 |
12 |
7 |
2 |
4 |
8 |
48 |
13.6 |
<0.01 |
29.9 ± 5.8 |
|
Rrn-2, Cabb |
7 |
l |
0 |
2 |
13 |
4 |
0 |
4 |
13 |
48 |
31.4 |
<<0.001 |
16.7 ± 4.2 |
|
Cab, Aat-md |
11 |
|
0 |
22 |
|
4 |
7 |
|
8 |
52 |
11.9 |
<0.01 |
22.2 ± 6.4 |
|
Rrn-2, Aat-md |
13 |
|
1 |
14 |
|
3 |
8 |
|
6 |
45 |
5.5 |
<0.1 |
30.9 ± 8.0 |
a Genotypic designations: 11 - JI 1794 or PI 179449 homozygotes, 22 - Slow or A1078-234 homozygotes, and 12 - heterozygotes (for Cab, 1 and 2 represent haplotypes).
b l:2:1:2:4:2:1:2:1 expected ratio.
c 1:3:2:6:1:3 expected ratio; in this cross, Rrn-2 band scored as present or absent.
d 3:1:6:2:3:1 expected ratio; due to dominance, oh heterozygote listed as 11; Aat-m band scored as present or absent.
e 3:l:9:3 expected ratio; in this cross, Rrn-2 band scored as present or absent; due to dominance, oh heterozygote listed as 11.
f Reciprocal cross.
g Calculated using the LINKAGE-1 computer program (4).
Fig. 1. Linkage group relationships for chromosome 7. The upper diagram represents the putative arrangement of linkage groups recently proposed by Weeden et al. (6), the space between the upper and lower chromosome arms indicating an unconfirmed association. The scale is in centimorgans (cM). The middle and lower diagrams depict mapping relationships generated from data in Table 1 that support the proposed association. The middle linkage map shows the intrachromosomal assignments among a group of genetic loci segregating in F2 progeny from the cross SLOW x JI1794, while the lower linkage map shows similar results from the cross A1078-234 x PI179449. Other genetic loci shown in the upper diagram do not segregate in the crosses used and, thus, are not included in these analyses.
Blixt, S. 1974. In Handbook of Genetics, Ed. R.C. King, Plenum Press, pp. 181-221.
Murfet, I.C. 1990. Pisum Newsl. 22:38-40.
Polans, N.O., Weeden, N.F. and Thompson, W.F. 1985. Proc. Natl. Acad. Sci. USA 82:5083-5087.
Suiter, K. A., Wendel, J.F. and Case, J.S. 1983. J. Heredity 74:203-204.
Swiecicki, W.K. 1990. isum Newsl. 22:62-63.
Weeden, N.F., Ambrose, M. and Swiecicki, W.K. 1991. Pisum Genet. 23:cover.
Weeden, N.F. and Marx, G.A. 1984, J. Heredity 75:365-370.
Weeden, N.F. and Wolko, B. 1990. In Genetic Maps, Ed. S. O'Brien, Cold Spring Harbor Laboratory Press, Cold Spring Harbor, New York, pp. 6106-6112.