PNL Volume 16 1984 RESEARCH REPORTS
SUPPLEMENTAL LINKAGE DATA FOR CHROMOSOMES 1 AND 5
Marx, G. A. NYS Agricultural Experiment Station, Geneva, NY USA
Creep-Ce-Fs
In 1982 (5) I reported evidence showing that creep is situated on
chromosome 5. With respect to other markers on that chromosome, the
following order was suggested: Cr-Creep-Fs-Ce. A line homozygous reces-
sive for creep ce fs was recovered from the above study and was used in
the three-point test reported here (Table 1.) The present data confirm
the previous findings in all essential respects except that the inten-
sity of linkage among creep, ce and fs is stronger in this study and
that the order apparently is creep-ce-fs rather than creep-fs-ce. The
order indicated by the present data conforms with the order given in
Lamprecht's 1968 map [see (1)].
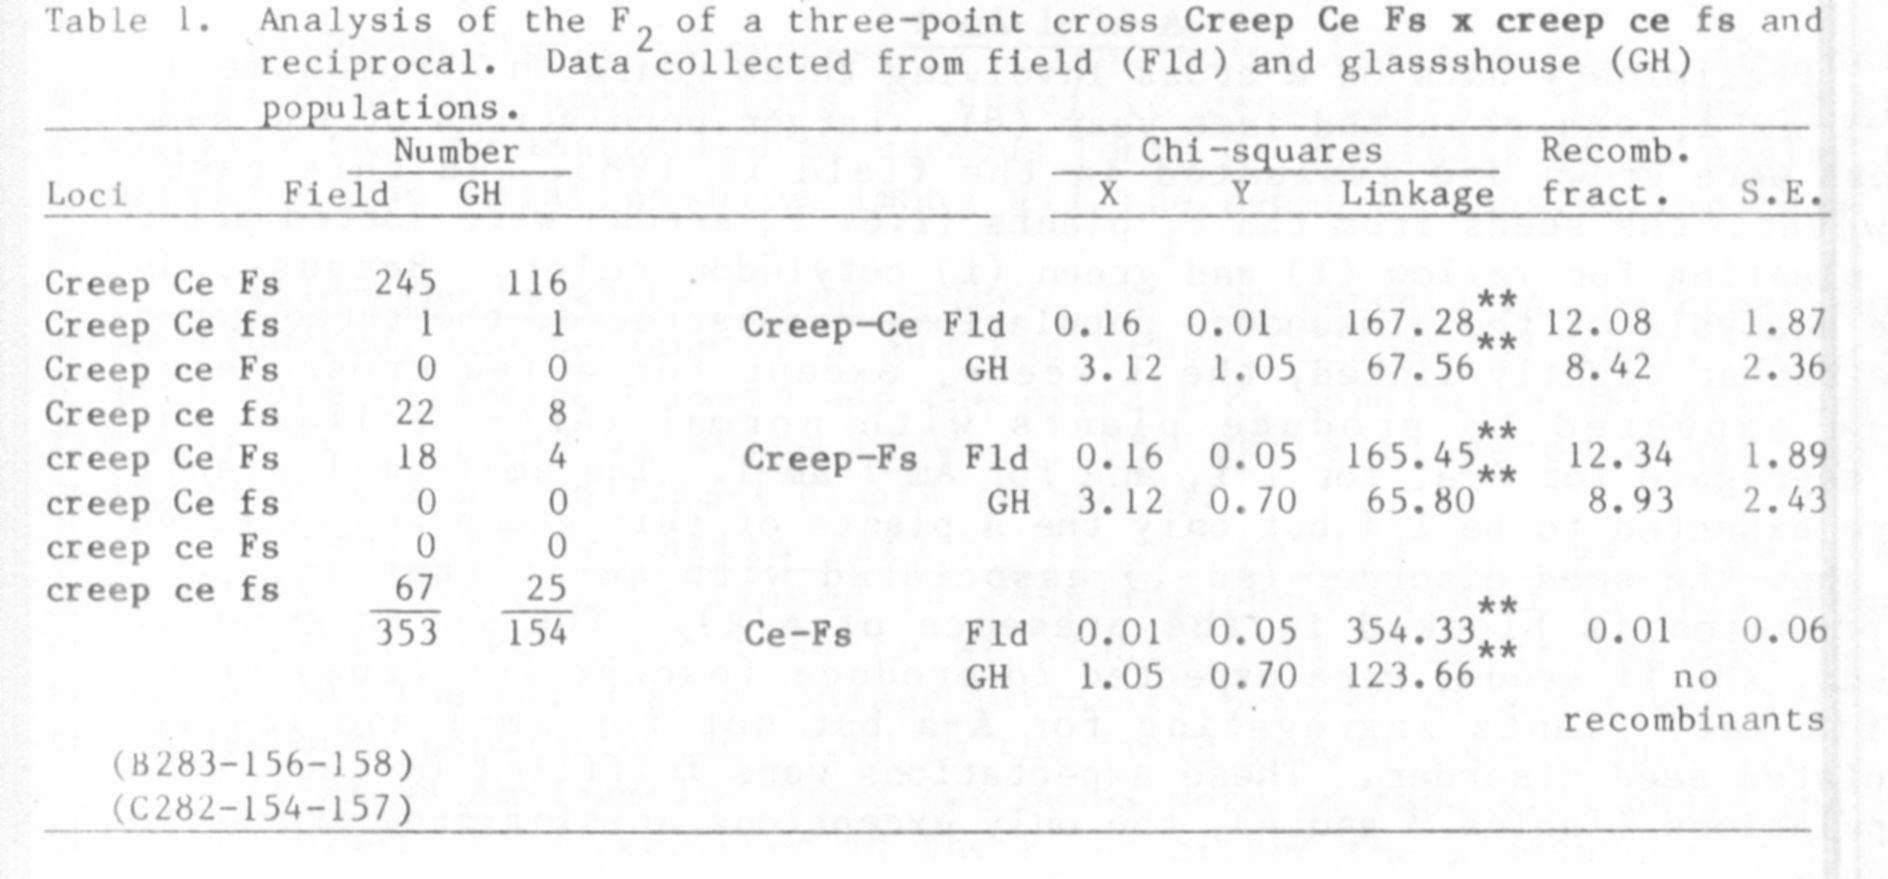
The data are divided into two separate analyses because the overall
experiment was conducted in part in the glasshouse and in part in the
field. There was some question about the genotype of 18 F2 segregants,
so these plants were progeny tested to verify their genotype. There
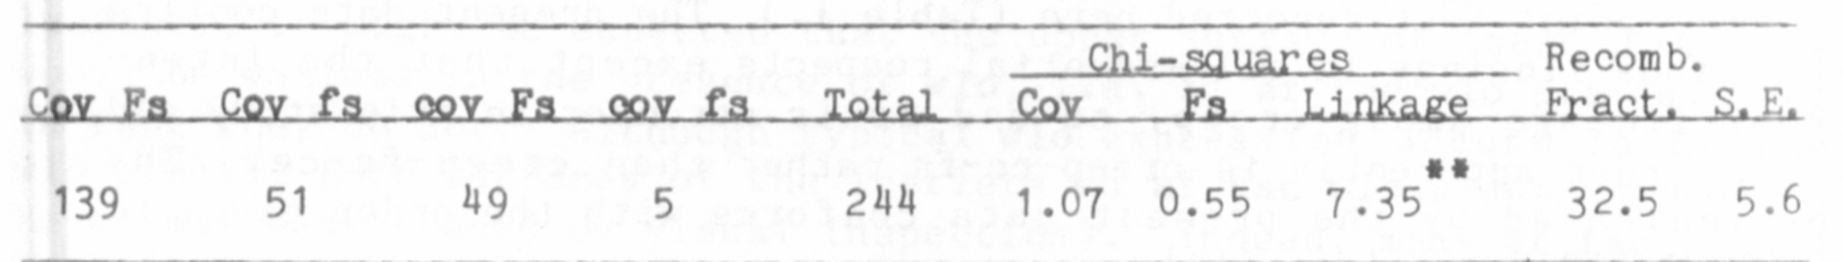
were only two Ce fs crossover F2 plants in the combined populations
comprising 507 plants.
50 PNL Volume 16 1984
RESEARCH REPORTS
Cov Fs
Evidence adduced previously has indicated that cov, a chlorophyll
gene which confers a distinct blue-green foliage color (but without
affecting pod color), is located on chromosome 5 in the vicinity of cr
and gp (3,4). These results lead to the expectation, demonstrated
herein, that cov should show evidence of linkage with fs (Table 2).
Table 2. Analysis of the F2 of a repulsion phase cross Cov fs x cov Fs.
A-Af-I-Am-1
Preliminary data on a cross involving three genes on chromosome 1 ,
af-i-am-1, was reported last year (6). Larger populations of the same
cross were grown and evaluated in the field in 1983. In this case,
however, the seeds from the F1 plants (i.e. F2 seeds) were sorted prior
to planting for yellow (I) and green (i) cotyledon color. Because, as
the analysis of the glasshouse populations demonstrated, the three genes
are rather tightly linked, the I seeds, except for a few crossovers,
were expected to produce plants with normal (Af/-) foliage but
to segregate for A-a, for I-i, and for Am-l-am-1. The am-l/am-1 plants
were expected to be I/I but only the A plants of this group are expected
to show the seed disorder (sd-1) associated with am-1 (that is, sd-2
expression is blocked in the presence of a/a). The second group of
seeds, the ii seeds, were expected to produce (except for crossovers)
afila (af) plants segregating for A-a but not for am-1 and its as-
sociated seed disorder. These expectations were fulfilled in the field
populations (Tables 3 and 4), the only exceptions arising from crossover
events.
PNL Volume L6 1984
RESEARCH REPORTS
51
Although the cross represents a four-point linkage test, the data
are presented as combinations of specific gene pairs. In view of the
complexity that is introduced by various forms of epistasis it is easier to
comprehend the relationships among all the genes by considering them in
pairs.
Wild-type vs white flower color: The two parents in the cross were
white flowered, one because of a and the other because of am-1. The F1
plants bore wild-type flowers and the overall F2 population satisfactorily
fit a 9:7 for colored vs white flowers, the white flowered class being
composed of a/a and am-l/am-1 plants (Table 3).
Norma1 (Af) vs afila (af) habit and yellow (I) vs green (i)
cotyledons : Since i is linked in coupling phase with af in this cross,
nearly all ii seeds gave rise to af plants, but some crossovers were
recovered and the calculated linkage intensity between af and i was 3.72 in
the glasshouse population and 5.60 in the field populations (Table 4).
Af-af vs Am-l-am-1: These two genes were in repulsion phase and no
crossover plants were recovered in the F2 of either the glasshouse or field
populations (Tabie 4). This result is consistent with a previous study
(2) involving a comparable number of plants. In both cases progeny tests
were required to extract af - am-1 recombinants. In the present case, 32
am-1 F2 segregants were progeny tested and, of those, five progenies
segregated for Af-af, the estimated recombination fraction being 9 + 4% (vs
8+3% for the 1969 experiment).
Am-l-am-1 vs I-i: These two genes also were in repulsion and,
again, no am-1-i plants were recovered in F2 (Table 4). The progeny tests
which were performed to recover af-am-1 plants (described in previous
paragraph) were not all carried into the adult plant stage so no estimate
of the intensity of linkage between am-1 and i Is possible from these
studies, except that the combined F2 populations indicate that the value is
less than 13%. However, one crossover progeny was found among a group of
selected plants that were grown to maturity.
1. Blixt, S. 1972. Agri Hort. Genet. 30:1-293.
2. Marx, G. A. 1969. PNL 1:9-10.
3. Marx, G. A. 1972. PNL A:30-31.
4. Marx, G. A. 197A. PNL 6:30-31.
5. Marx, G. A. 1982. PNL 14:41-42.
6. Marx, G. A. 1983. PNL 15:43-45.